1989-90 NBA Standings
|
|||||||||||||||||||||||||||||||||||||||||||||||||||||
Glossary
| W | Overall wins on the season. |
| L | Overall losses on the season. |
| PCT | Overall win percentage on the season (W / W + L). |
| STR | Winning or losing streak. |
| GB | Number of games trailing the division leader. |
| PF | Average points scored by the team. |
| PA | Average points allowed by the team. |
| AWAY | W-L record in games played on the road. |
| HOME | W-L record in games played at home. |
| DIV | W-L record in games played against divisional opponents. |
| CONF | W-L record in games played against conference opponenets not in the same division. |
| NON | W-L record in games played against teams from the other conference. |
| BAS | W-L record in games played before the All-Star Game (Feb 11, 1990). |
| AAS | W-L record in games played after the All-Star Game (Feb 11, 1990). |
| FM | W-L record in games decided in Final Minute action. |
| ≥10 | W-L record in games decided by 10 or more points. |
| ATLANTIC | W | L | PCT | GB | STR | PF | PA | AWAY | HOME | DIV | CONF | BAS | AAS | FM | ≥10 |
|---|---|---|---|---|---|---|---|---|---|---|---|---|---|---|---|
| Boston Celtics | 9 | 5 | 0.643 | - | W4 | 111.1 | 108.1 | 3-4 | 6-1 | 2-1 | 7-5 | 9-5 | 0-0 | 2-2 | 5-3 |
| New York Knicks | 6 | 5 | 0.546 | 1.5 | W3 | 104.8 | 103.7 | 2-4 | 4-1 | 2-0 | 4-2 | 6-5 | 0-0 | 1-1 | 3-3 |
| Washington Bullets | 6 | 8 | 0.429 | 3.0 | W1 | 107.9 | 109.6 | 2-7 | 4-1 | 2-1 | 4-3 | 6-8 | 0-0 | 1-2 | 4-4 |
| Philadelphia 76ers | 4 | 7 | 0.364 | 3.5 | L1 | 107.6 | 107.6 | 2-4 | 2-3 | 2-2 | 2-6 | 4-7 | 0-0 | 0-2 | 2-2 |
| Miami Heat | 5 | 9 | 0.357 | 4.0 | L1 | 104.9 | 110.1 | 3-6 | 2-3 | 2-4 | 5-5 | 5-9 | 0-0 | 0-1 | 2-6 |
| New Jersey Nets | 4 | 8 | 0.333 | 4.0 | W1 | 105.9 | 109.9 | 3-5 | 1-3 | 1-3 | 3-4 | 4-8 | 0-0 | 1-1 | 3-5 |
| CENTRAL | W | L | PCT | GB | STR | PF | PA | AWAY | HOME | DIV | CONF | BAS | AAS | FM | ≥10 |
| Cleveland Cavaliers | 7 | 4 | 0.636 | - | L3 | 109.0 | 102.4 | 3-2 | 4-2 | 4-1 | 6-3 | 7-4 | 0-0 | 1-0 | 6-2 |
| Chicago Bulls | 8 | 5 | 0.615 | - | L2 | 105.2 | 102.4 | 6-3 | 2-2 | 1-1 | 2-2 | 8-5 | 0-0 | 3-2 | 3-2 |
| Detroit Pistons | 7 | 5 | 0.583 | 0.5 | L1 | 103.3 | 100.8 | 2-4 | 5-1 | 4-2 | 7-4 | 7-5 | 0-0 | 1-1 | 4-3 |
| Milwaukee Bucks | 6 | 5 | 0.546 | 1.0 | L1 | 99.9 | 98.6 | 2-3 | 4-2 | 3-0 | 6-3 | 6-5 | 0-0 | 0-0 | 3-2 |
| Atlanta Hawks | 5 | 6 | 0.455 | 2.0 | L4 | 115.1 | 117.2 | 1-5 | 4-1 | 2-4 | 4-6 | 5-6 | 0-0 | 1-0 | 2-4 |
| Orlando Magic | 3 | 9 | 0.250 | 4.5 | L3 | 105.3 | 112.8 | 0-7 | 3-2 | 1-4 | 3-5 | 3-9 | 0-0 | 1-1 | 2-5 |
| Indiana Pacers | 2 | 8 | 0.200 | 4.5 | W1 | 98.8 | 107.2 | 1-4 | 1-4 | 0-3 | 1-6 | 2-8 | 0-0 | 0-1 | 0-5 |
| MIDWEST | W | L | PCT | GB | STR | PF | PA | AWAY | HOME | DIV | CONF | BAS | AAS | FM | ≥10 |
| Utah Jazz | 8 | 2 | 0.800 | - | L1 | 114.0 | 98.3 | 2-0 | 6-2 | 5-0 | 5-1 | 8-2 | 0-0 | 0-1 | 6-1 |
| Dallas Mavericks | 7 | 4 | 0.636 | 1.5 | W2 | 110.8 | 106.5 | 2-3 | 5-1 | 1-1 | 6-4 | 7-4 | 0-0 | 2-0 | 3-4 |
| Houston Rockets | 8 | 5 | 0.615 | 1.5 | W2 | 111.8 | 108.0 | 6-2 | 2-3 | 2-2 | 5-3 | 8-5 | 0-0 | 1-1 | 5-2 |
| Denver Nuggets | 7 | 5 | 0.583 | 2.0 | L1 | 106.6 | 106.6 | 5-1 | 2-4 | 4-2 | 7-4 | 7-5 | 0-0 | 0-2 | 4-2 |
| Charlotte Hornets | 5 | 6 | 0.455 | 3.5 | L2 | 104.4 | 102.1 | 1-4 | 4-2 | 0-3 | 1-6 | 5-6 | 0-0 | 1-1 | 4-1 |
| San Antonio Spurs | 5 | 6 | 0.455 | 3.5 | L1 | 101.5 | 101.3 | 3-4 | 2-2 | 0-3 | 3-5 | 5-6 | 0-0 | 0-1 | 3-3 |
| Minnesota Timberwolves | 5 | 8 | 0.385 | 4.5 | W1 | 99.8 | 104.3 | 3-3 | 2-5 | 2-3 | 4-5 | 5-8 | 0-0 | 2-2 | 1-4 |
| PACIFIC | W | L | PCT | GB | STR | PF | PA | AWAY | HOME | DIV | CONF | BAS | AAS | FM | ≥10 |
| Los Angeles Lakers | 8 | 3 | 0.727 | - | W3 | 110.5 | 104.5 | 3-1 | 5-2 | 1-1 | 6-3 | 8-3 | 0-0 | 0-1 | 6-2 |
| Phoenix Suns | 7 | 3 | 0.700 | 0.5 | W1 | 113.8 | 111.5 | 3-1 | 4-2 | 4-1 | 5-2 | 7-3 | 0-0 | 1-0 | 5-3 |
| Portland Trail Blazers | 8 | 5 | 0.615 | 1.0 | W4 | 109.6 | 108.2 | 2-2 | 6-3 | 3-1 | 4-4 | 8-5 | 0-0 | 5-1 | 3-3 |
| Seattle SuperSonics | 6 | 7 | 0.462 | 3.0 | L1 | 102.4 | 108.4 | 2-5 | 4-2 | 0-2 | 3-5 | 6-7 | 0-0 | 3-1 | 1-4 |
| Golden State Warriors | 5 | 6 | 0.455 | 3.0 | W2 | 110.3 | 111.0 | 1-4 | 4-2 | 2-2 | 4-4 | 5-6 | 0-0 | 1-1 | 3-3 |
| Sacramento Kings | 4 | 7 | 0.364 | 4.0 | L2 | 106.5 | 108.9 | 1-3 | 3-4 | 1-3 | 3-3 | 4-7 | 0-0 | 0-1 | 2-4 |
| Los Angeles Clippers | 3 | 7 | 0.300 | 4.5 | W1 | 97.9 | 106.1 | 0-3 | 3-4 | 0-1 | 0-7 | 3-7 | 0-0 | 0-1 | 2-5 |
GAMES PLAYED ON NOVEMBER 26, 1989
Glossary |
This icon will be present if the winning team trailed after 3 periods. |
 |
This icon will be present if the game was within 4 at the end and went to the Final Minute. |
| LD | The biggest lead the team had during the game. |
| TEAMS | 1 | 2 | 3 | 4 | F | LD | |||||
|---|---|---|---|---|---|---|---|---|---|---|---|
| Chicago Bulls | 18 | 27 | 30 | 21 | 96 | Box score | 10 | 2 ties, 4 lead changes | |||
| Los Angeles Clippers | 19 | 18 | 44 | 23 | 104 | 10 | |||||
| TEAMS | 1 | 2 | 3 | 4 | F | LD | |||||
| San Antonio Spurs | 17 | 35 | 15 | 28 | 95 | Box score | - | 1 ties, 0 lead changes | |||
| Los Angeles Lakers | 21 | 39 | 29 | 16 | 105 | 26 | |||||
| TEAMS | 1 | 2 | 3 | 4 | F | LD | |||||
|
|
Detroit Pistons | 23 | 25 | 20 | 27 | 95 | Box score | 8 | 4 ties, 7 lead changes | |
| Portland Trail Blazers | 19 | 25 | 23 | 31 | 98 | 7 | |||||
TODAY'S IMPACT POINT LEADERS
 Buck WILLIAMS (POR) 5.25 | 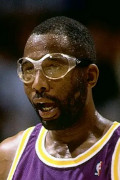 James WORTHY (LAL) 4.50 |  Tom GARRICK (LAC) 4.50 |  Joe WOLF (LAC) 3.25 |  Scottie PIPPEN (CHI) 3.00 |